Scattered Data
Important information is often split between spreadsheets, databases, business systems, and technical platforms.
HilalX helps businesses turn scattered data, systems, and daily operations into clear dashboards, monitoring views, and management reports that support better decisions.
Many companies already have the data they need, but it is spread across Excel files, systems, reports, and technical tools. The result is slow reporting, unclear priorities, and limited visibility for management and operations teams.
Important information is often split between spreadsheets, databases, business systems, and technical platforms.
Reports take time to prepare, depend on people, and may already be outdated when management receives them.
Teams cannot easily see operational performance, system health, risks, and next actions in one clear view.
HilalX focuses on practical visibility: dashboards that explain performance, monitoring views that show system health, and reports that help teams understand what needs attention.
Dashboards for KPIs, sales, inventory, operations, and executive reporting, built from the data your business already uses.
Clear views for uptime, trends,service health, system status, capacity, backup status, and incidents.
Monthly reports, SLA summaries, performance notes, risk highlights, and practical recommendations.
We do not start by selling tools. We start by understanding what needs to be visible, who needs to see it, and what decisions the information should support. Then we build the simplest useful solution.
You do not need a large transformation project to begin. Start with one useful dashboard, one visibility review, or one monthly report.
Turn Excel, SQL, or operational data into a clear dashboard for management and daily decisions.
Create a simple view of uptime, service health, capacity, backup status, and incidents.
A monthly report that explains performance, incidents, risks, capacity, and recommended actions.
Clean up scattered files, manual reports, and inconsistent data sources into a better reporting flow.
See performance, issues, and priorities without waiting for manual updates.
Turn technical status into clear visibility and management-ready reports.
Monitor daily activity, bottlenecks, and operational KPIs.
Create visibility for systems, uptime, incidents, capacity, and reporting.
Build dashboards for sales, stock, movement, and performance.
Alongside dashboards and reporting, HilalX can support the infrastructure behind business systems, monitoring, and operational visibility.
Static websites, DNS, SSL/TLS, Cloudflare setup, secure publishing workflows, and lightweight hosting guidance for fast and reliable web delivery.
Network design, connectivity review, routing, switching, VPN planning, firewall coordination, and operational visibility for network services.
Security review, hardening, access control, firewall review, SSL/TLS, and cybersecurity services delivered with trusted security partners when deeper assessment is required.
End-to-end data center and systems design covering servers, virtualization, storage, networking, high availability, capacity planning, and production readiness.
Backup strategy, restore testing, RPO/RTO planning, disaster recovery readiness, reporting, and practical recovery improvement plans.
Storage planning, capacity reporting, NAS/SAN/Ceph support, usage visibility, performance review, and expansion planning.
Practical migration planning for moving workloads from on-premises or legacy environments to suitable cloud or hybrid platforms with clear risk, cost, and rollback planning.
Cloud and hybrid architecture design focused on availability, security, cost control, networking, backup, monitoring, and operational visibility.
HilalX works across data, infrastructure, monitoring, cloud, security, and operational systems. Tools are selected based on the business outcome, environment, budget, and operational need.
A useful report should not only show numbers. It should explain performance, incidents, risks, capacity, and the next actions management should consider.
Read the guideGuides and articles about dashboards, operational reports, infrastructure visibility, and practical data operations.
A useful monthly operational report should not only show numbers. It should explain performance, incidents, risks, capacity, and the next actions management should consider.
Read moreA place for future examples of dashboard, reporting, and infrastructure visibility work.
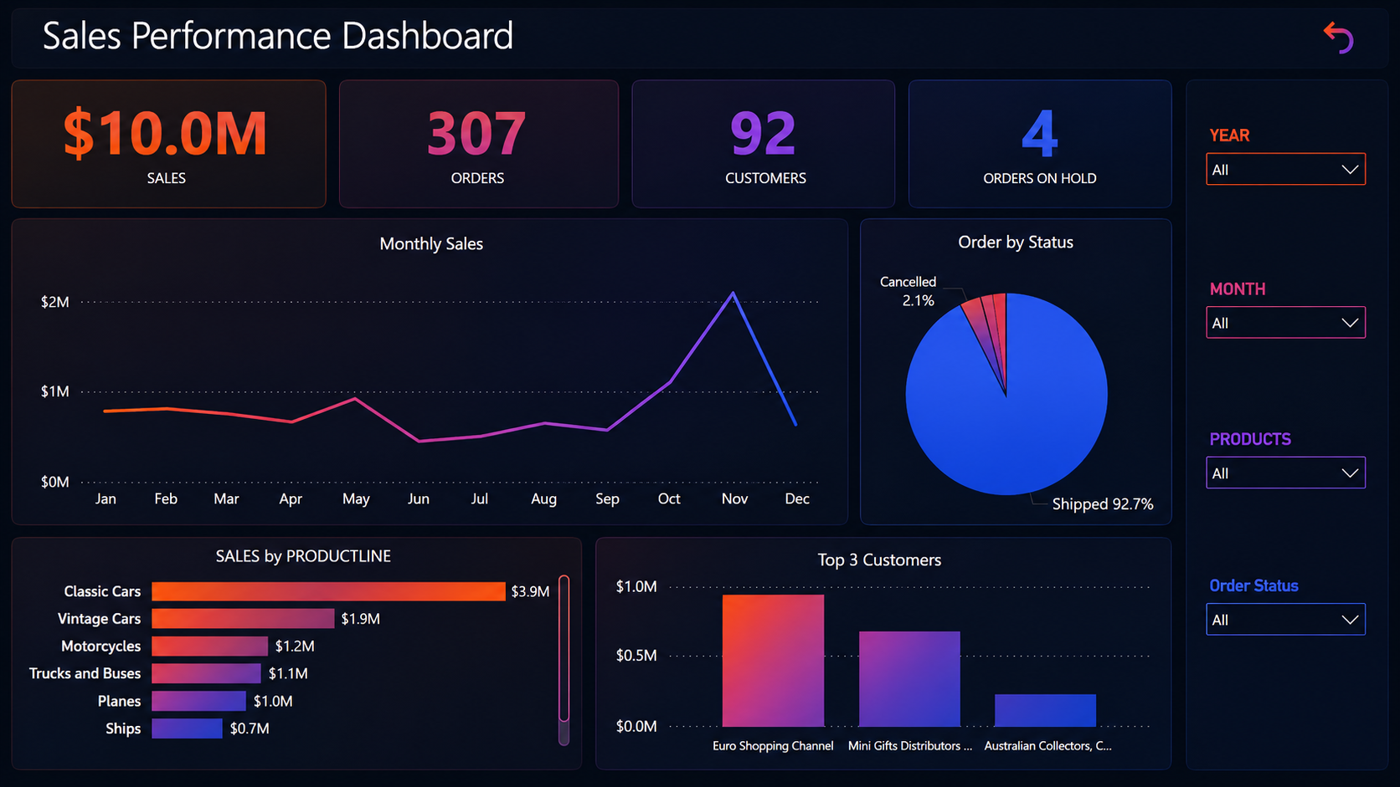
A practical example showing how scattered sales data can be transformed into a clear management dashboard for performance, orders, customers, products, and trends.
View case studySend us your current reporting, dashboard, or system visibility challenge. We will suggest a practical starting point without overcomplicating the solution.