Demo Case Study: Sales Performance Dashboard
This is a demo case study that shows how sales and operational data can be turned into a clear management dashboard.
The goal is not only to display numbers, but to help decision makers quickly understand performance, trends, risks, and areas that need attention.
The Challenge
Sales data is often available, but it may be scattered across spreadsheets, exports, sales systems, or manual reports.
This creates common problems:
- Management waits for manual reporting
- Sales performance is hard to compare month by month
- Customer and product performance is not clear
- Teams spend time preparing reports instead of reading insights
- Decisions are made without a complete picture
The Dashboard Objective
The objective of this dashboard is to provide one clear view of sales performance.
It helps answer questions such as:
- How much sales did we generate?
- How many orders were created?
- Which customers are performing best?
- Which product lines generate the most revenue?
- Are monthly sales improving or declining?
- Are there orders on hold or issues that need review?
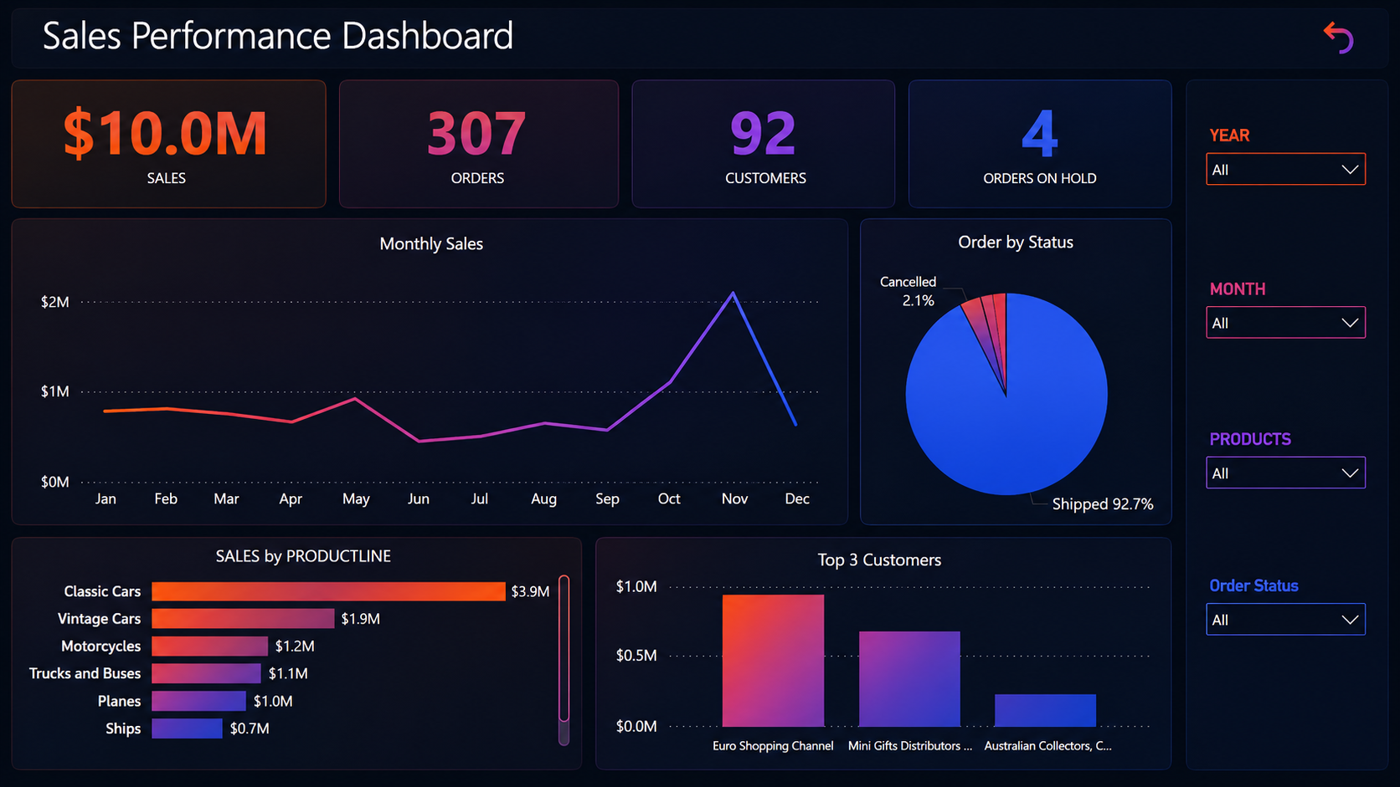
What the Dashboard Shows
The dashboard includes key sales and operational indicators, such as:
- Total sales
- Number of orders
- Number of customers
- Orders on hold
- Monthly sales trend
- Orders by status
- Sales by product line
- Top customers
This gives both management and operational teams a quick way to understand performance without reviewing multiple reports.
Why It Matters
A dashboard like this helps the business move from manual reporting to operational visibility.
Instead of asking for reports every time, decision makers can see the most important indicators in one place.
This supports:
- Faster decisions
- Better sales visibility
- Clearer customer performance review
- Better product line analysis
- Easier monthly reporting
HilalX Approach
For this type of work, HilalX focuses on practical output.
The process usually includes:
1. Reviewing the current data sources
2. Understanding the reporting need
3. Defining the key metrics
4. Designing the dashboard layout
5. Building a refreshable reporting view
6. Reviewing the dashboard with the business team
7. Improving the report based on real usage
The result is a dashboard that is simple, readable, and useful for decision making.
Typical Outputs
A project like this can produce:
- Sales dashboard
- Management summary view
- Product performance report
- Customer performance report
- Monthly reporting template
- Recommended next actions
Final Thought
A good dashboard does not replace business judgment. It supports it.
When sales and operational data are presented clearly, teams can focus less on preparing reports and more on understanding what needs to happen next.
HilalX helps businesses turn scattered data, systems, and operations into clear dashboards, monitoring views, and management reports.