
For executives and operations managers, this fragmentation creates a severe blind spot. Instead of managing operations in real time, leadership spends hours every week manually compiling data just to understand basic performance metrics.
By the time a report is finished, the information is already old.
At HilalX, we solve this exact problem. This article demonstrates how a modern data architecture transforms raw, scattered rows into a clean, operational dashboard that drives faster corporate decisions.
The Core Challenge: The Cost of Scattered Data
Many organizations operate under a reactive management style. When data is siloed, companies face specific operational bottlenecks:
* Delayed Decision-Making: Management cannot see problems (such as regional delivery delays or inventory imbalances) until days after they occur. * Wasted Man-Hours: Valuable employees spend critical morning hours copying and pasting rows between files instead of analyzing efficiency. * Inconsistent Metrics: Different departments present conflicting figures because they pull data from separate, unverified sources.
To fix this, a business does not need more reports. It needs a single source of truth combined with clear design logic.
The Solution: A Unified Operational View
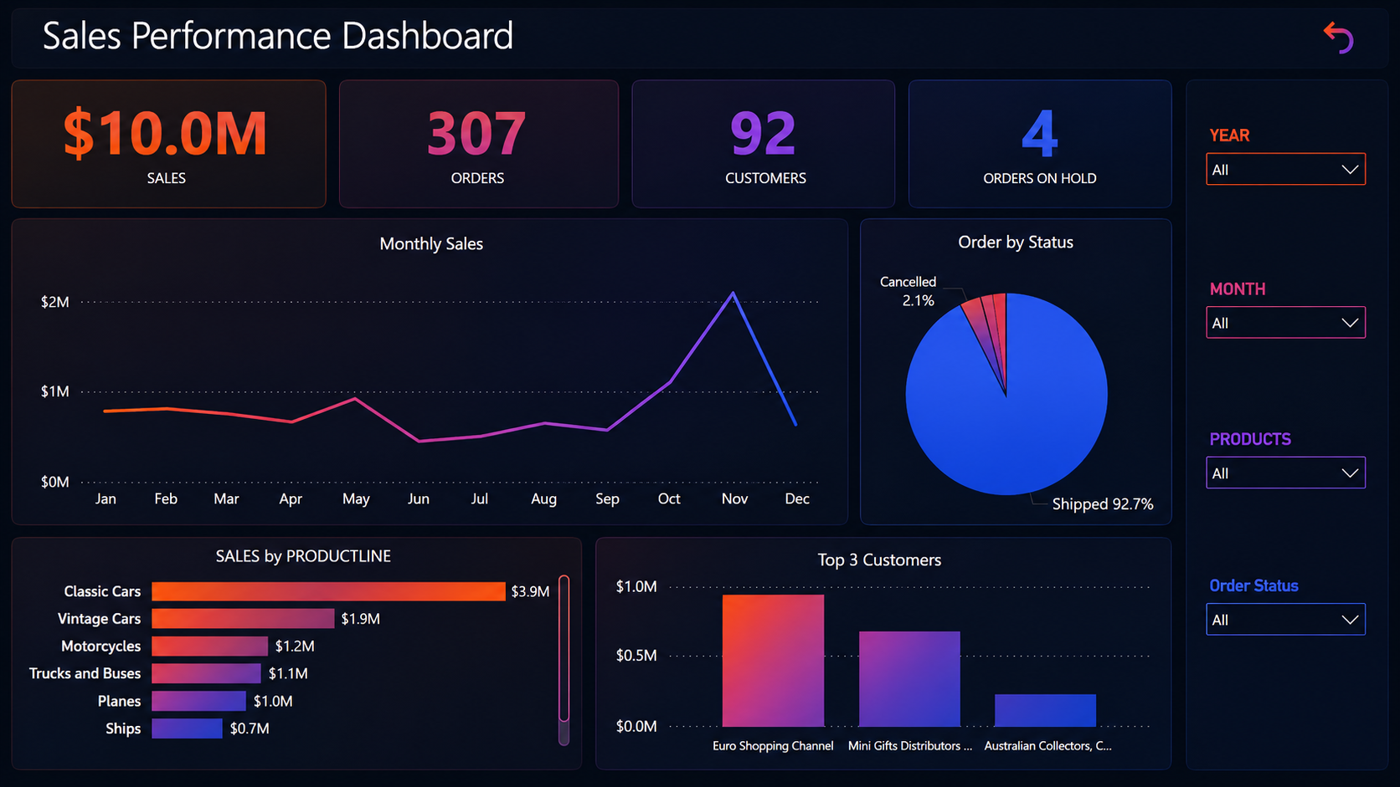
We built a localized enterprise environment designed to aggregate multi-category product information and display it automatically. Below is the exact operational framework used to achieve data clarity:
1. Automated Data Ingestion
Instead of manual data collection, automated pipelines constantly monitor external sources (such as emails, supplier portals, or local logs). The system automatically extracts new entries and writes them directly into a secured, centralized database.
2. Strategic Design Standards
A dashboard must be functional, not decorative. Using a standardized corporate color system (deep backgrounds for low eye strain, explicit color coding for alerts), we map data points to match specific business objectives.
* Orange/Rust Accents: Highlight current volumes and active metrics. * Red Labels: Indicate critical operational bottlenecks that require immediate intervention. * Muted Grays: Represent historical baseline data for context.
Key Dashboard Breakthroughs for Leadership
When data is unified correctly, the dashboard instantly answers four fundamental executive questions:
Total Volume At a Glance
A central breakdown card shows exactly how many total orders are moving through the infrastructure across all product lines. Management can monitor high-level volume without navigating complex menus.
Historical Revenue Growth
A structured line graph tracks quarterly performance over multiple fiscal years. This allows leadership to instantly see long-term trends and seasonal demand shifts without manual calculations.
Revenue vs. Target Tracking
Instead of checking a separate financial plan, the dashboard places live quarterly revenue directly against the organization's fixed goal line. A dynamic progress bar reveals exactly how close the team is to hitting the corporate milestone.
The Business Outcome
Shifting from manual spreadsheets to an automated operational view delivers immediate business metrics:
1. Zero Manual Compilation: Reports update automatically, returning hours of productive time back to operational teams. 2. Proactive Management: Leaders spot performance dips early in the quarter, allowing them to adjust strategy before targets are missed. 3. Unified Team Alignment: Every department looks at identical, verified figures, eliminating internal data arguments.
Stop searching through messy corporate files. Start managing your operations with absolute clarity.
Ready to Unify Your Corporate Reporting?
If your management team is still relying on manual spreadsheets to track daily operations, let’s build a clean solution tailored to your workflow.